A Sherpa for Your Mountains of Data

Sometimes, you say it best when you say nothing at all. In our paper at the upcoming VDS 2019 symposium that is co-located with IEEE VIS 2019 in Vancouver, BC, Canada at the end of October, we study how to infer user intent merely from how they view a data. How a person navigates in a dataset, we argue, says something about which parts of the data the person is interested in. Take stock market data for the last decade, for example. If a stock analyst immediately scrolls to May 2010 in the timeline, this suggests that the analyst is most interested in data around this time period (such as the 2010 Flash Crash on May 6, 2010). Knowing this information, it makes sense that any pending computations — such as predictions, portfolios, and valuations — should be focused on the time period of interest rather than anywhere else in the dataset. After all, given the chance to prioritize calculations, we should choose the parts most interesting to the user, right?
This is precisely the idea behind our new Sherpa method. Letting the user control the order of computation, which is known as computational steering, is not a novel concept. Inferring the user’s interest from their navigation is novel, however, and makes a lot of sense in situations where the user has little specialized knowledge in algorithms and steering. In our paper, we present two specific applications of the Sherpa method: for gene regulation in biology applications (Sherpa Gene), and for stock market analysis (Sherpa Stock).
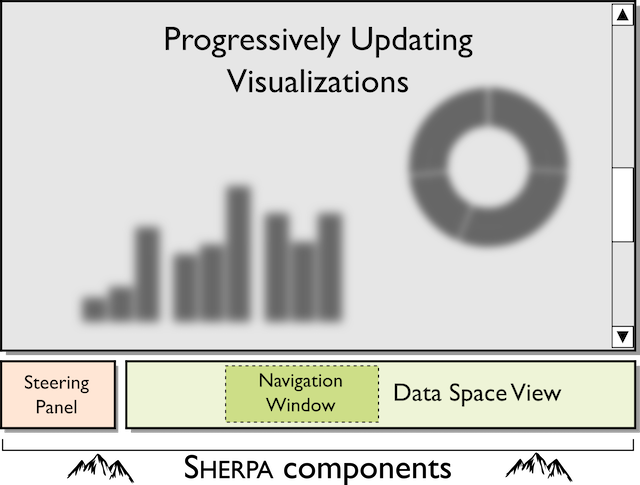
The basic Sherpa interface with a progressively updating view, a data space view with a navigation window controlled by the user, and a steering panel for manually controlling the computation.
The idea behind Sherpa requires only three components: (1) a dataset in which the user can navigate; (2) a computation where the order of computation is not important; and (3) a visualization that can be updated over time as new data is computed. With these components, we can use the Sherpa method for any application (see the interface sketch above).
The concept of computation with no prescribed order is perhaps the most complex of the Sherpa requirements: it simply means that the items (or groups of items) in the dataset can be computed with no regard to data that comes before or after in the sequence. Calculating the average of all stocks for a specific day is an example of such a computation, but calculating the average for all days in the dataset is not. This concept, which is also known as parallelizability in distributed computing, is actually rather strict: few algorithms have this feature. In fact, the ones that do are often called “embarrassingly parallel”, in that sharing their calculation across a large group of computers is trivial. Nevertheless, while there certainly are situations that call for embarrassingly parallel algorithms, research in distributed computing has over the years come up with many ingenious ways to make even highly complex and inter-dependent algorithms parallelizable.
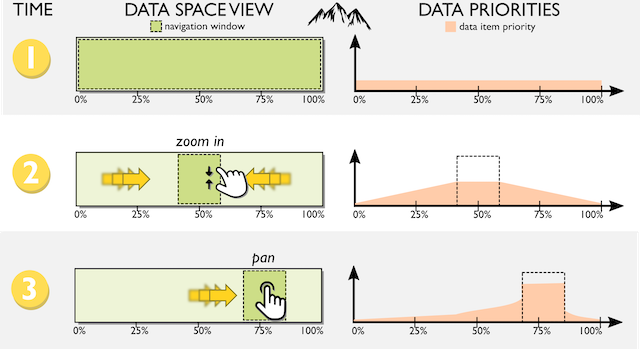
Mining the user’s navigational pattern as they move the navigation window over the data space.
Regardless of which algorithm is used, the Sherpa model will track the user’s interaction as they pan and zoom the navigation window over the data space view (see image above). While the whole data space is in view, all items in the dataset will share the same priority for computation. However, whenever the user zooms in on a region, the computation priority will begin to accumulate the longer the time user spends viewing that region. Regions that have not been in view recently will see their priorities diminish over time. All the while, the computation will continue running in the background, always choosing the item with the currently highest priority as the next computation target.
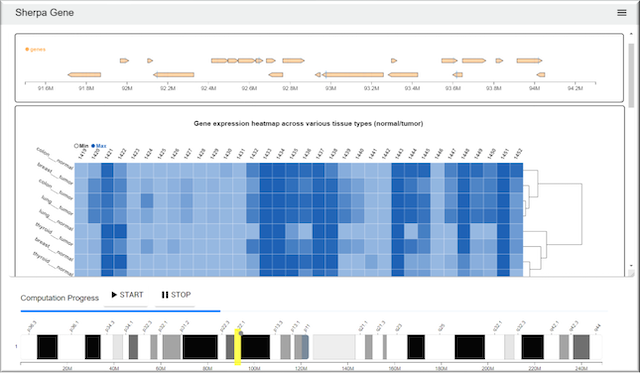
Sherpa Gene, a web-based visualization application for genomics based on the Sherpa model. Navigating between genes on the sequence ideogram at the bottom of the display will change the computation priority.
To understand the tradeoffs of the Sherpa approach, we studied how five researchers in bioinformatics and visualization used the Sherpa Gene application to study gene sequence data. We looked at three variants: (1) blocked, where the full computation was finished before the trial commenced (an unrealistic baseline for big data), (2) progressive output, where the calculation proceeded from beginning to end but could not be steered, and (3) Sherpa, where the Sherpa method was used to steer computation based on user navigation. Not surprisingly, participants found the Sherpa condition the most effective one, particularly when asked about specific locations in the gene. While we expected such results, we also note that in situations when the computation is in fact parallelizable, our work suggests that adding Sherpa functionality is beneficial and has little or no drawbacks.
Sherpa will be presented on Sunday, October 20, 2019 in Ballroom A at the Vancouver Convention Centre (East). Full paper information: Zhe Cui, Jayaram Kancherla, Hector Corrada Bravo, and Niklas Elmqvist. Sherpa: Leveraging User Attention for Computational Steering in Visual Analytics. In Proceedings of the Symposium on Visualization in Data Science (VDS), 2019. [PDF]